
In October 2024, the U.S. economy saw a modest increase in wholesale prices, reflecting a slight uptick in inflation. The Bureau of Labor Statistics reported that the Producer Price Index (PPI) rose by 0.2% on a seasonally adjusted basis. While this increase aligns with market expectations, it highlights the ongoing, yet moderate, inflationary pressures within the economy. This article will break down the data, analyze inflation trends across various U.S. regions, and discuss the broader implications for the economy and consumers.
What is the Producer Price Index (PPI)?
The Producer Price Index is a critical measure used by economists to track the average change over time in the prices received by domestic producers for their output. It serves as an important inflation gauge, measuring price changes before they reach the consumer Unlike the Consumer Price Index (CPI), which tracks the prices consumers pay for goods and services, the PPI focuses on the prices producers receive for their products.
For October 2023, the PPI increased by 0.2% from the previous month. This represents a slight rise compared to the 0.1% increase seen in September, but still falls within the range of what economists had anticipated. On an annual basis, wholesale inflation measured 2.4%, suggesting that while inflation is still above the Federal Reserve’s target of 2%, the overall trend is moderating.
How Wholesale Prices Increased in October
The 0.2% rise in October was largely driven by a variety of factors, particularly within services. Services, which make up a significant portion of the PPI, saw a 0.3% increase for the month. This was primarily driven by a notable 3.6% jump in portfolio management prices. While this figure is higher than the previous month’s reading, the overall increase was relatively contained compared to earlier in the year.
Core PPI Performance
Excluding volatile items such as food and energy, the core PPI showed a 0.3% increase in October. This marked a one-tenth of a percentage point increase from September’s 0.2% rise, in line with expectations. Core inflation, which excludes food and energy prices to give a clearer view of underlying inflation trends, now stands at 3.1% on an annual basis. While this remains above the Federal Reserve’s 2% target, it suggests that inflationary pressures are being driven by isolated factors rather than broad-based increases in prices.
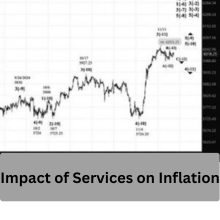
Impact of Services on Inflation
Services played a crucial role in the PPI rise for October. The 0.3% increase in services prices was the largest contributing factor to the overall PPI growth. Within this category, portfolio management prices surged by 3.6%. This large increase is primarily due to rising costs in financial services, including investments and management fees, which have been steadily climbing due to increasing demand for financial products and services.
Decline in Food and Energy Prices
While services saw price increases, food and energy prices were a different story. Food prices fell by 0.2% in October, continuing the trend of moderating food price inflation. Energy prices also dropped by 0.3%, marking a second consecutive month of declines. These declines help offset some of the pressures from other sectors, contributing to the overall moderate increase in wholesale prices for the month.
Goods Prices Show Minor Growth
Goods prices, which had been falling for the past couple of months, saw a minor rise of 0.1% in October. While this increase is small, it suggests that the market for physical goods is stabilizing after a period of deflation. The slight uptick in goods prices reflects some stabilization in sectors like manufacturing and retail, although it remains far from the rapid price hikes seen in previous years.
Federal Reserve’s Interest Rate Policy
The Federal Reserve has been closely monitoring inflation data to determine its next steps regarding interest rates. Given the relatively modest increase in wholesale prices, market expectations are that the Fed will proceed with further interest rate cuts in December. Many analysts believe that a quarter-point reduction is likely, with additional cuts expected in 2025. The goal is to continue cooling the economy to bring inflation closer to the 2% target, while ensuring that growth remains steady.
Also read: Coastal Flooding Hits Delaware & Philly Counties: Stay Safe Friday
Regional Inflation Differences
One of the most significant takeaways from the latest inflation data is how inflation rates vary across different regions of the U.S. While the national inflation rate was 2.6% in October, certain areas experienced higher or lower inflation rates. This regional variation is important because it affects consumers’ daily costs differently depending on where they live.
Inflation in the Northeast
The Northeast region recorded the highest inflation rate in the country for October, with a year-over-year increase of 3.5%. This was significantly higher than the national average and represented the fastest inflation rate among the four U.S. regions. Within the Northeast, New York saw the highest inflation at 4%, driven by rising housing and food costs. New England had inflation of 3.3%, while the Middle Atlantic region, including states like New Jersey and Pennsylvania, saw inflation at 3.6%.
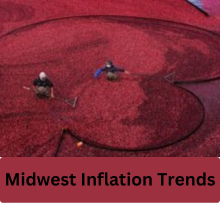
Midwest Inflation Trends
In the Midwest, inflation was slightly higher in October, registering 2.6%. Chicago, with an inflation rate of 3.5%, had the second-highest inflation rate among major metro areas. This was an improvement from September when Chicago’s inflation was at 4.1%. Detroit saw a smaller increase of 3.3%, while cities like St. Louis had more moderate inflation at 2.6%.
Southern U.S. Inflation
The Southern U.S. region, which includes cities like Miami, Houston, and Atlanta, experienced a range of inflation rates. Miami had the highest inflation in the South at 2.7%, fueled by rising housing and utility costs. In contrast, cities like Houston and Atlanta saw more modest inflation rates of 2.1% and 1.9%, respectively.
West Coast and Mountain Region Inflation
The West region, including the Pacific and Mountain areas, had the slowest inflation rates in October. The Pacific region saw inflation of 2.4%, slightly higher than the 2.3% seen in September. The Mountain region experienced a slight cooling in inflation, dropping from 1.4% to 1.3%, suggesting that inflationary pressures in these areas are easing.
Consumer Behavior and Economic Impact
The varying inflation rates across regions have a direct impact on consumer behavior. In areas with higher inflation, consumers may be more cautious with their spending, while in regions with lower inflation, purchasing power may remain more stable. This regional disparity highlights the importance of localized economic strategies to address inflation’s impact on different communities.
Also read: Bad Sisters Season 2: Anne-Marie Duff Teases Shocking Plot Twists
Conclusion
October’s inflation report provides a nuanced picture of the U.S. economy. Wholesale prices rose modestly by 0.2%, with core inflation at 3.1%. While inflation is still above the Federal Reserve’s target, it is being driven by isolated factors rather than broad-based price increases. The Northeast and Midwest continue to experience higher inflation rates compared to the national average, particularly in metro areas like New York and Chicago.
Looking ahead, the Federal Reserve is expected to continue its policy of interest rate cuts to further moderate inflation, but the pace of these cuts may slow as inflation cools. Understanding regional inflation variations is crucial for policymakers and consumers alike, as different areas of the country experience vastly different economic conditions.
FAQs
-
What is the Producer Price Index (PPI)?
- The PPI measures the average change in prices received by domestic producers for their output. It is an important indicator of inflation trends in the economy.
-
Why did services contribute most to the rise in PPI?
- Services, particularly financial services like portfolio management, saw a significant price increase, which drove much of the PPI rise in October.
-
Which U.S. region had the highest inflation in October?
- The Northeast region had the highest inflation, with a rate of 3.5% for the month, largely driven by rising housing and food costs.
-
How does the Federal Reserve respond to inflation trends?
- The Federal Reserve adjusts interest rates to manage inflation. In response to the latest data, the Fed is expected to cut rates again in December.
-
What impact does regional inflation have on consumers?
- Regional inflation differences affect consumers’ purchasing power. Areas with higher inflation may see consumers cutting back on spending, while those in areas with lower inflation may face less economic strain.